Diving Birds Case Study
We present several case studies on specific taxa or phenomena. Each case study includes the integration of data from multiple study components, presenting a comprehensive view of wildlife distribution and movement patterns. These case studies include:
- Northern Gannets
- Scoters
- Red-throated Loons
Northern Gannets
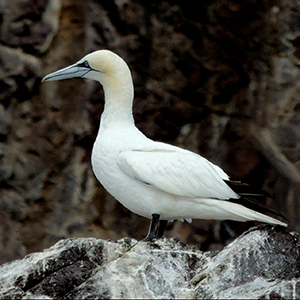
The Northern Gannet is the largest breeding seabird in the North Atlantic Ocean. This species was a focus of this study because it is abundant in the mid-Atlantic in winter, during non-breeding periods. Previous studies conducted in Europe have also indicated a range of possible effects of offshore wind development on Northern Gannets, including collision mortality and displacement.
Distribution and Abundance
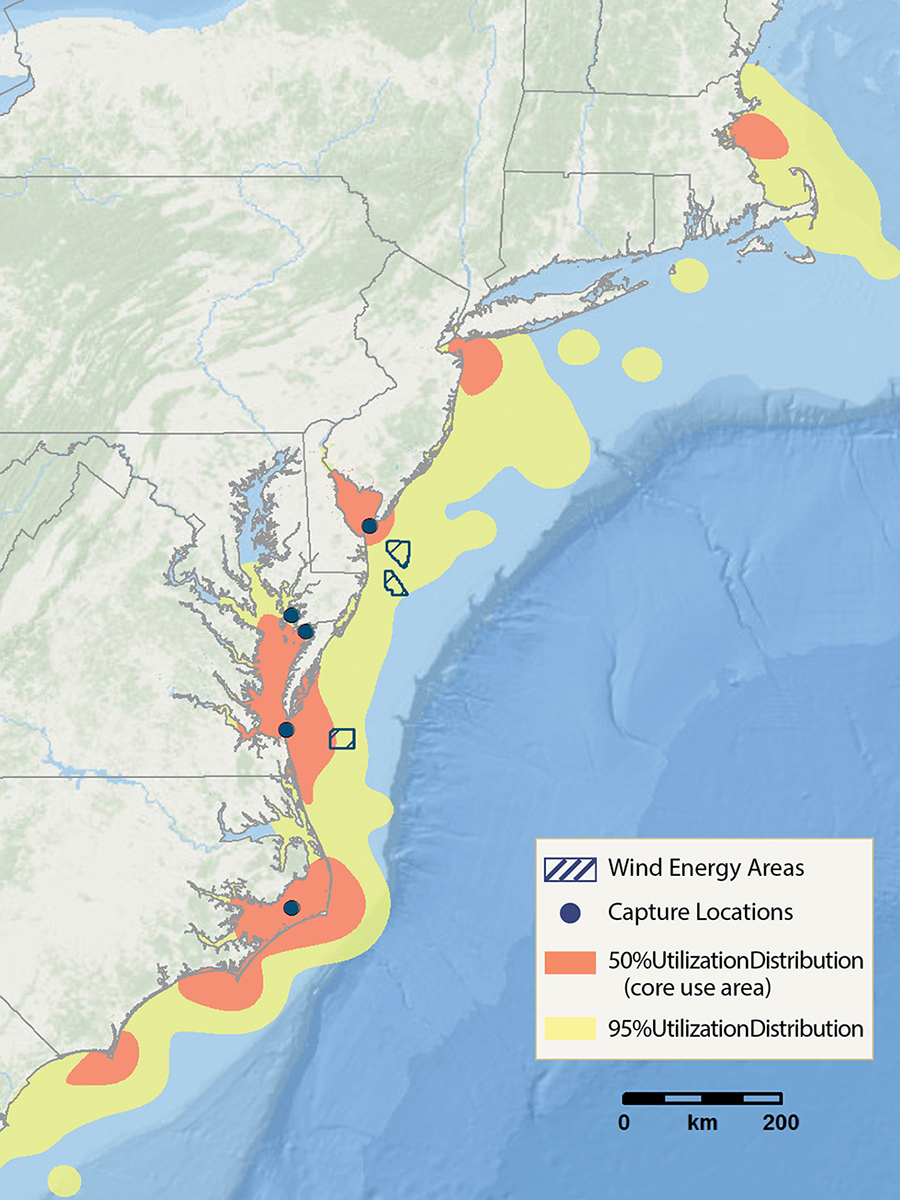
Winter distribution of Northern Gannets tracked via satellite telemetry (n=17; preliminary data).
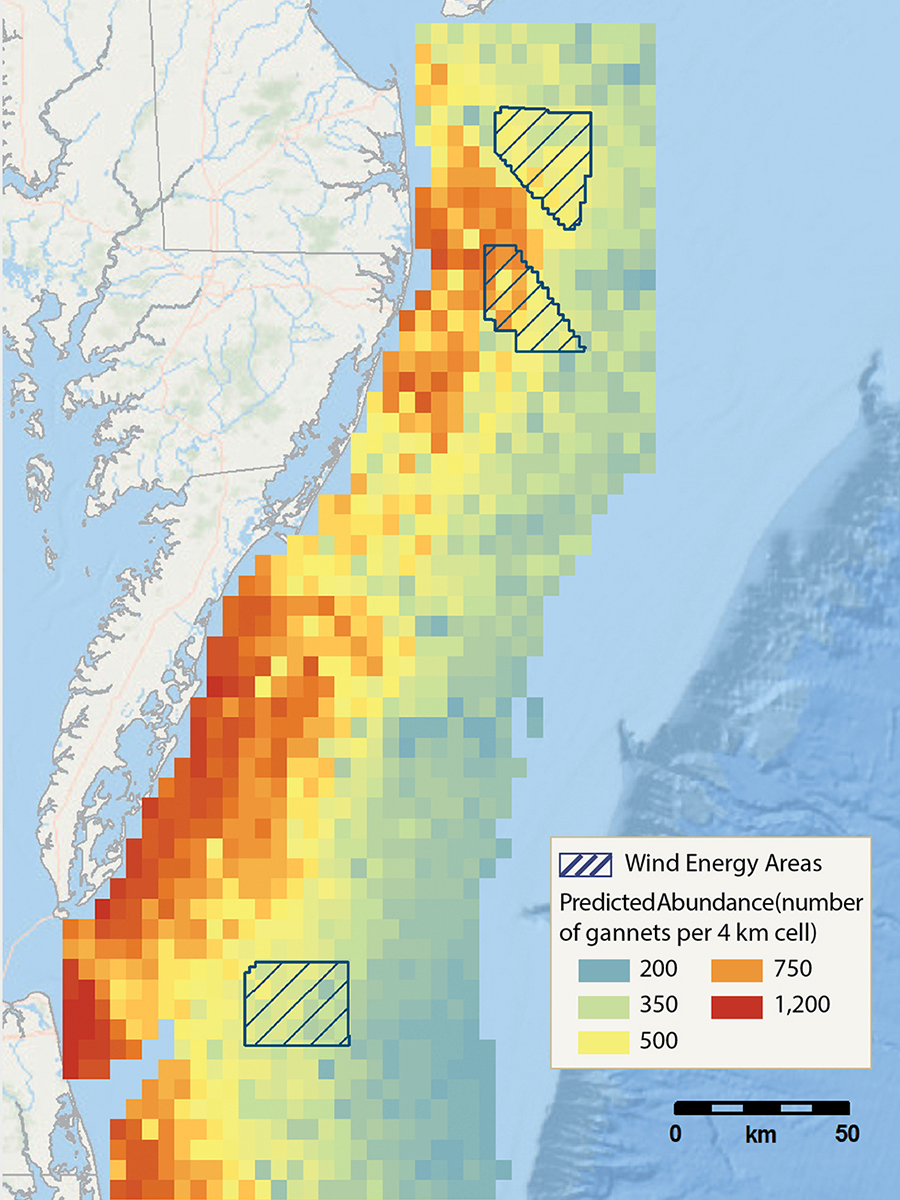
Predicted abundance of Northern Gannets for a given day in the winter of 2013-2014 (Nov.-Jan.) Models used observation data from boat-based surveys and remotely sensed environmental covariate data to predict abundance across the study area. The highest abundance of Northern Gannets was predicted to occur closer to shore in regions with high primary productivity.
Behavior and Habitat Use
Northern Gannet migration was highly asynchronous and widely dispersed across the continental shelf; they generally moved up the coast in March-April, often pausing in large bays. Birds typically left breeding colonies in September and either followed the coast or the shelf edge southward, arriving in the wintering area in November-December. Individuals roamed widely through the area in winter, showing low site fidelity.
Northern Gannets were most consistently observed in nearshore waters in our surveys, although telemetry data showed them regularly ranging as far as 50 km onto the continental shelf. The birds generally used habitat characterized by highly productive, shallower waters, with lower sea surface salinities, especially areas closer to shore and over fine sandy substrate.
Temporal Variation
Northern Gannets were observed from boat-based and digital aerial surveys year round, with the highest numbers observed between September and April.
Satellite tracked Northern Gannets first arrived in the mid-Atlantic in August, with peak arrival time around November, and they departed between February and May. A time variant kernel density model of satellite telemetry data was developed to improve our understanding of the species’ use of the landscape through time. The movement video generated from this model is shown here.
Take Home Messages
- The broad-scale distribution and movements of Northern Gannets during winter may increase the likelihood that individuals would be in the vicinity of offshore wind developments repeatedly throughout the season.
- Important foraging and habitat use areas appear to be defined by a wide variety of habitat characteristics. Construction and operations of offshore wind energy facilities, including associated vessel traffic, could potentially cause localized displacement anywhere in the study area, but this is most likely within about 30-40 km of shore where Northern Gannets were more abundant.
Scoters
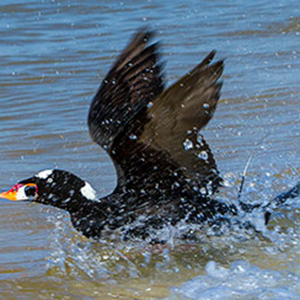
Scoters are medium-sized sea ducks that breed in the Arctic. Three scoter species live in North America and winter in the mid-Atlantic (Black, Surf, and White-winged Scoters). This taxon was a focus of this study because they are highly abundant in the study area, and European studies found that scoters may be displaced from areas around offshore wind facilities for some period of years following construction.
Distribution and Abundance
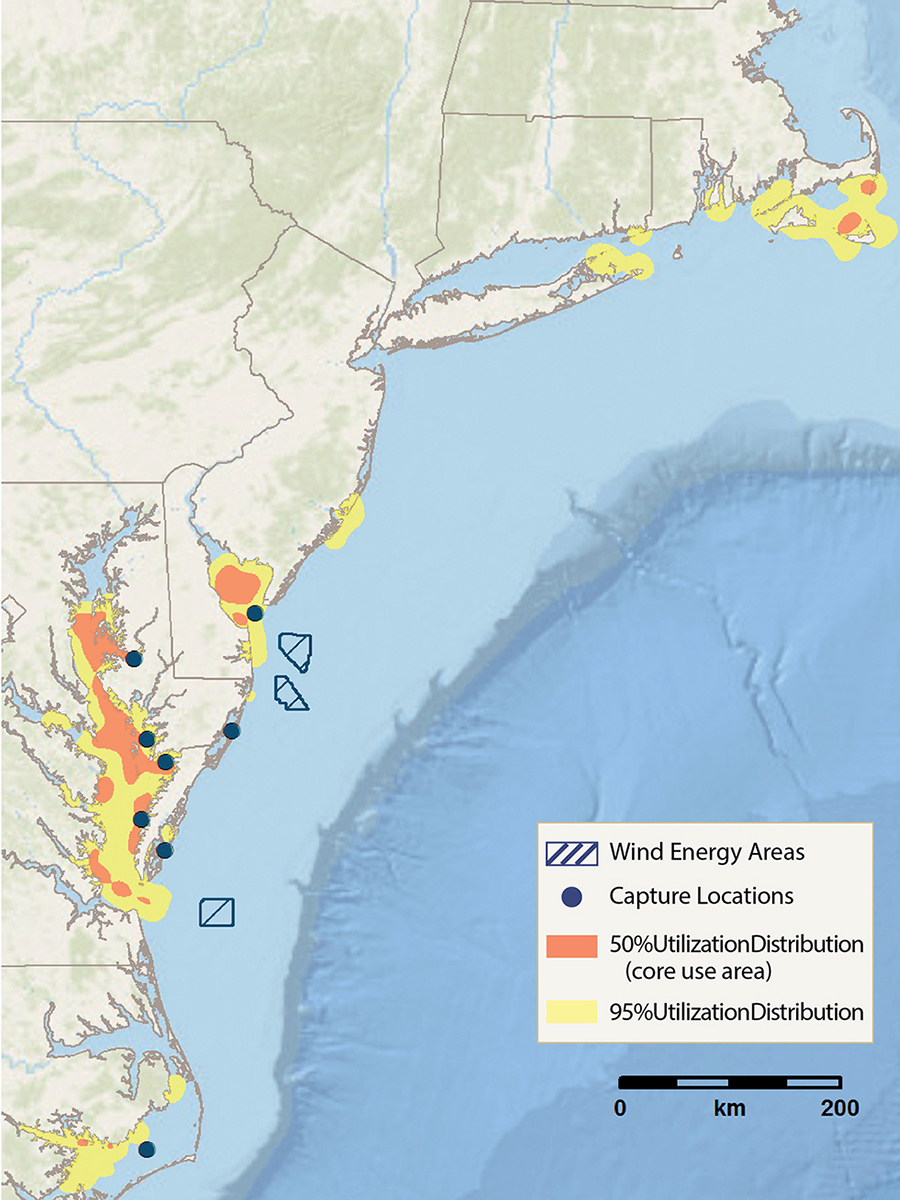
Winter utilization distribution for satellite-tagged Surf Scoters (n=101; data are preliminary). Additional capture locations in Labrador, Québec, and New Brunswick are not shown on this map.
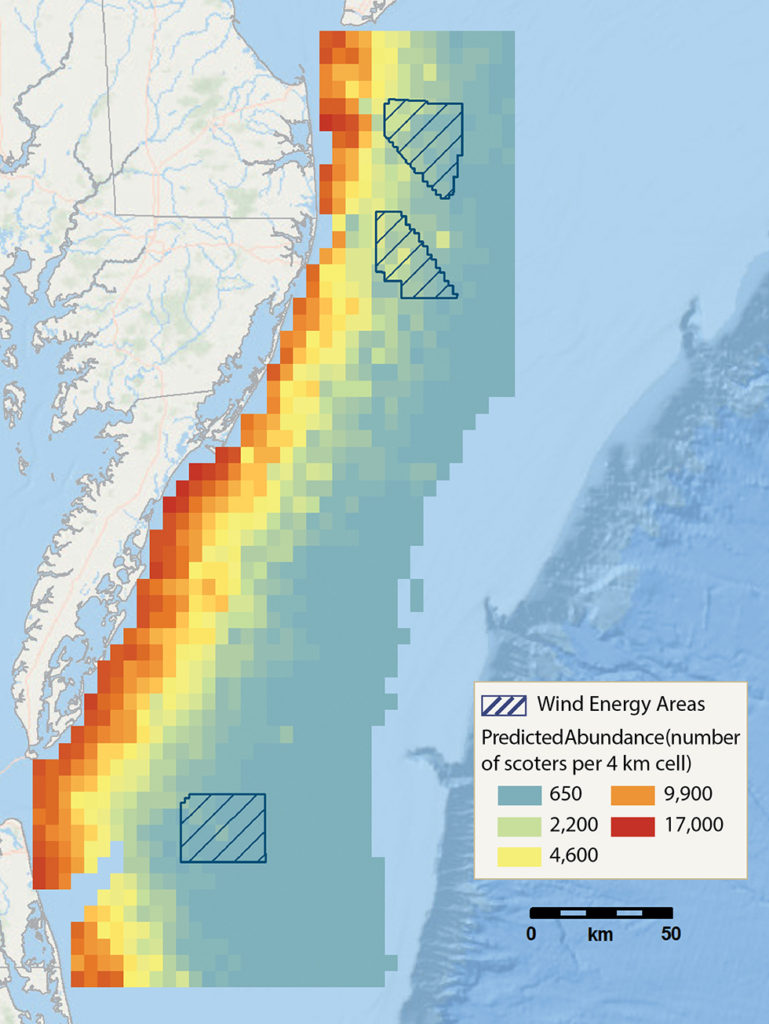
Predicted abundance of scoters (including White-winged, Black, and Surf Scoters) for a given day during winter 2013-2014. Model outputs combine observation data from boat-based surveys with environmental covariate data to predict scoter abundance across the study area. The highest abundance of scoters was predicted to occur close to shore and in regions with high primary productivity.
Behavior and Habitat Use
Scoters were the most abundant avian genus observed over the course of the study. Individual satellite tagged Surf Scoters generally arrived between mid-October and mid-December, spending an average of 133 days in the region. In general, they left the study area between early January and mid-May, following the coast north to briefly stage in the St. Lawrence Estuary before continuing north to breeding and molting areas in northern Canada. The route was reversed during fall migration.
Large aggregations were most consistently observed at the mouth of Chesapeake Bay and just south of the mouth of Delaware Bay within about 30 km of shore. Survey and telemetry data showed scoters used habitat characterized by shallow nearshore waters with high primary productivity.
Temporal Variation
Surf Scoters were most commonly observed on the boat-based and digital aerial surveys in winter, and none were observed from May to August.
On average, Surf Scoters tracked with satellite telemetry arrived in the study area in November, and left in April. A time variant kernel density model of satellite telemetry data was developed to improve our understanding of the species’ use of the landscape through time. The movement video generated from this model is shown here
Take Home Messages
- Telemetry and survey data for scoters indicated strong nearshore distribution patterns, which held true across species and were largely driven by water depth.
- In the mid-Atlantic, construction and operation of offshore wind energy facilities (and associated vessel traffic) are most likely to cause localized displacement of scoters from high-quality feeding areas if these activities occur within about 20 km from shore.
Red-throated Loons
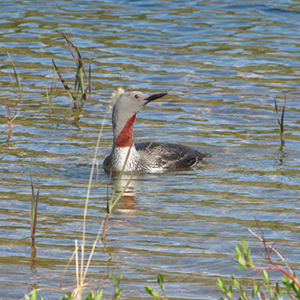
The Red-throated Loon is the most widespread member of the loon family, with a circumpolar distribution. Red-throated Loons were a focus of this study in the mid-Atlantic because European studies have indicated that they experience long-term, localized disturbance and displacement from wind energy facilities, as well as related activities such as vessel traffic.
Distribution and Abundance
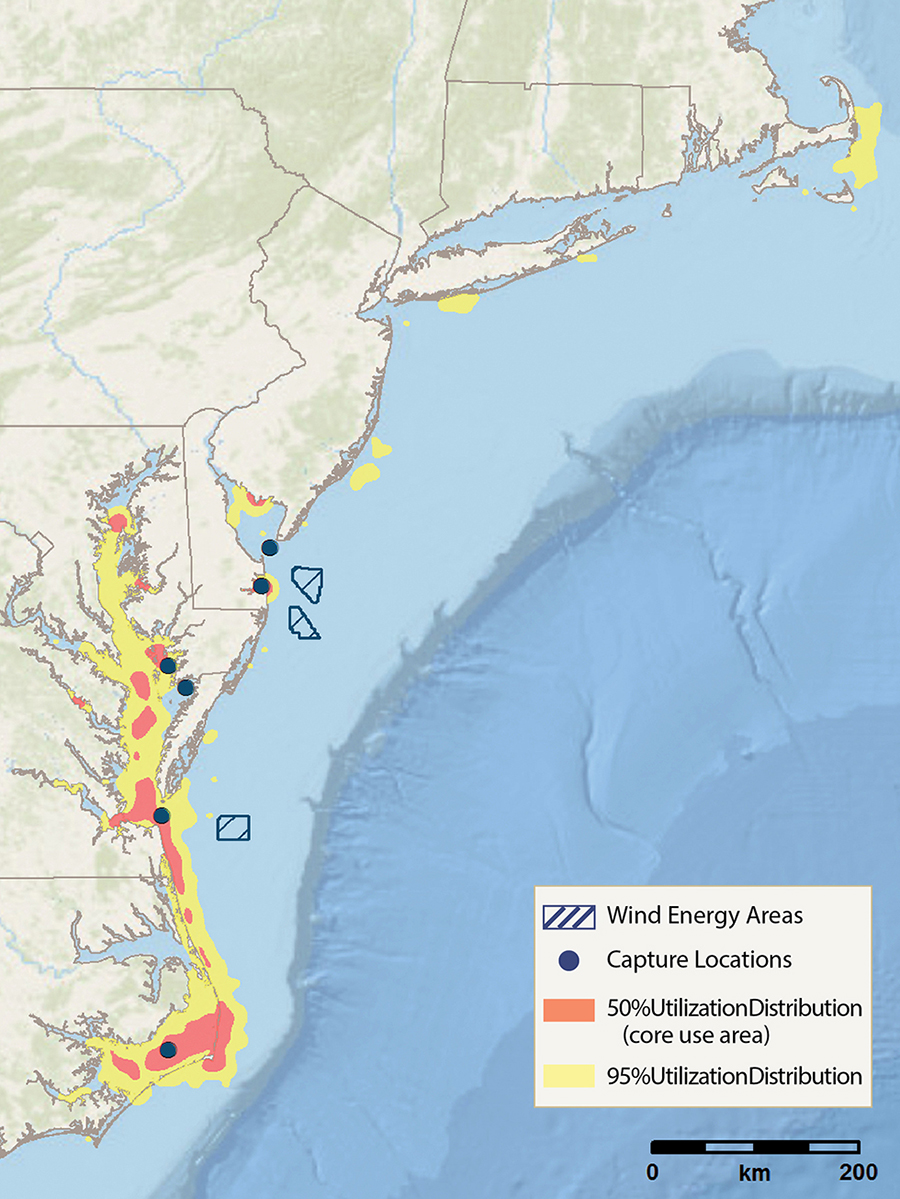
Winter utilization distribution for satellite-tagged Red-throated Loons (n=23; data are preliminary).
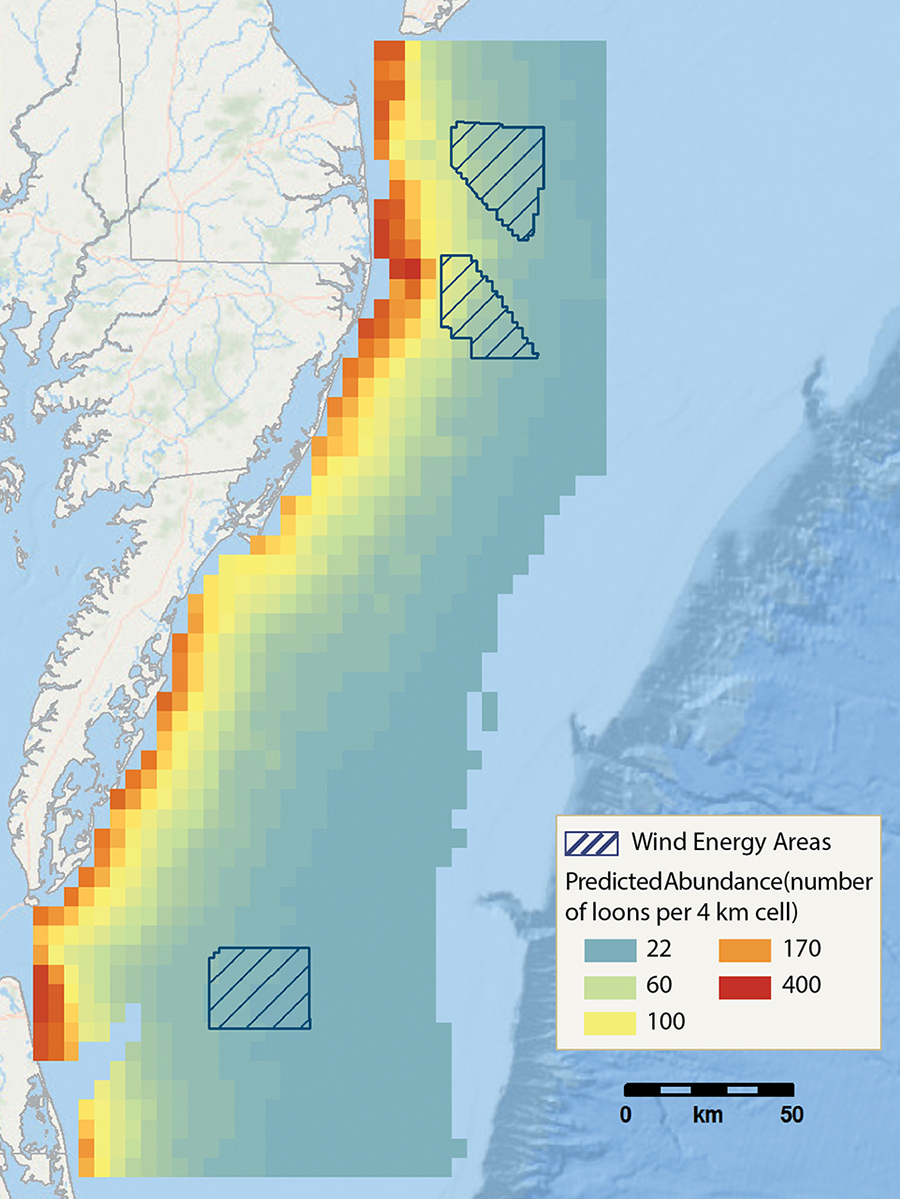
Predicted abundance of Red-throated Loons for a given day in winter 2013-2014. Model outputs combine observation data from boat-based surveys with environmental covariate data to predict Red-throated Loon abundance across the study area. The highest abundance of Red-throated Loons was predicted to occur close to shore and in regions with cooler water and high primary productivity.
Behavior and Habitat Use
Red-throated Loons were most consistently observed within within approximately 20 km of shore. This differed from Common Loons, which were more widely distributed across the study area. Telemetry data indicated that Red-throated Loons preferentially used shallow nearshore waters over flat sandy substrates while wintering in the mid-Atlantic, particularly around the mouth of Chesapeake Bay and south along the Virginia and North Carolina coasts. Modeled boat survey data indicated that proximity to shore was the strongest predictor of Red-throated Loon abundance, followed by relatively cold sea surface temperature, and primary productivity (low in spring, high in winter).
Satellite tagged individuals left the study area between late March and early May, largely following the coast north to breeding grounds. Greatest offshore movements occurred during this departure from the study area. During fall migration, loons arrived in the study area between mid-November and late December. Most individuals stopped over in Hudson Bay and moved either to the Gulf of St. Lawrence or the Great Lakes before flying to Delaware Bay and following the coastline south.
Temporal Variation
Red-throated Loons were most commonly observed on the boat-based and digital aerial surveys between November and May. No individuals were observed in July-August from either survey method.
Satellite tracked Red-throated Loons arrived in the study area between mid-November and late December, and departed beginning in late March, with all birds gone by May. A time variant kernel density model of satellite telemetry data was developed to improve our understanding of the species’ use of the landscape through time. The movement video generated from this model is shown here.
Take Home Messages
- The greatest overlap between Red-throated Loon distributions and mid-Atlantic WEAs occurred during migration periods, when movements tended to be located farther offshore.
- In winter, Red-throated Loons were most commonly located west of the WEAs.
Photo Credits: Header photo © BRI-Tim Divoll. Study Subjects: Northern Gannet © Joyce Amsden; Surf Scoter © Ginger Gumm; Red-throated loon © Dave Evers; Maps © BRI


