Background
We deployed satellite transmitters on Surf Scoters, Northern Gannets, Red-throated Loons, and Peregrine Falcons, four species that make use of the study area in winter or during migration periods. With this method, temporal coverage is limited only by battery power and tag longevity, making it possible to track movements of individuals year-round, regardless of weather or time of day (though such data are rarely continuous due to power limitations). Satellite transmitters send location data to orbiting satellites during predetermined periods of the day. Transmitters were programmed to maximize the number of locations obtained from time periods when the birds were expected to be in the mid-Atlantic region.
Birds were captured at several locations along the east coast of North America. Surf Scoters were captured during molting, fall and spring staging, and wintering periods at several sites in the United States and Canada. Red-throated Loons were captured between January and March in the mid-Atlantic, and Northern Gannets were captured during their wintering period in the mid-Atlantic and on a breeding colony in Canada. Satellite transmitters were attached to birds externally or were surgically implanted.
Analytical Methods
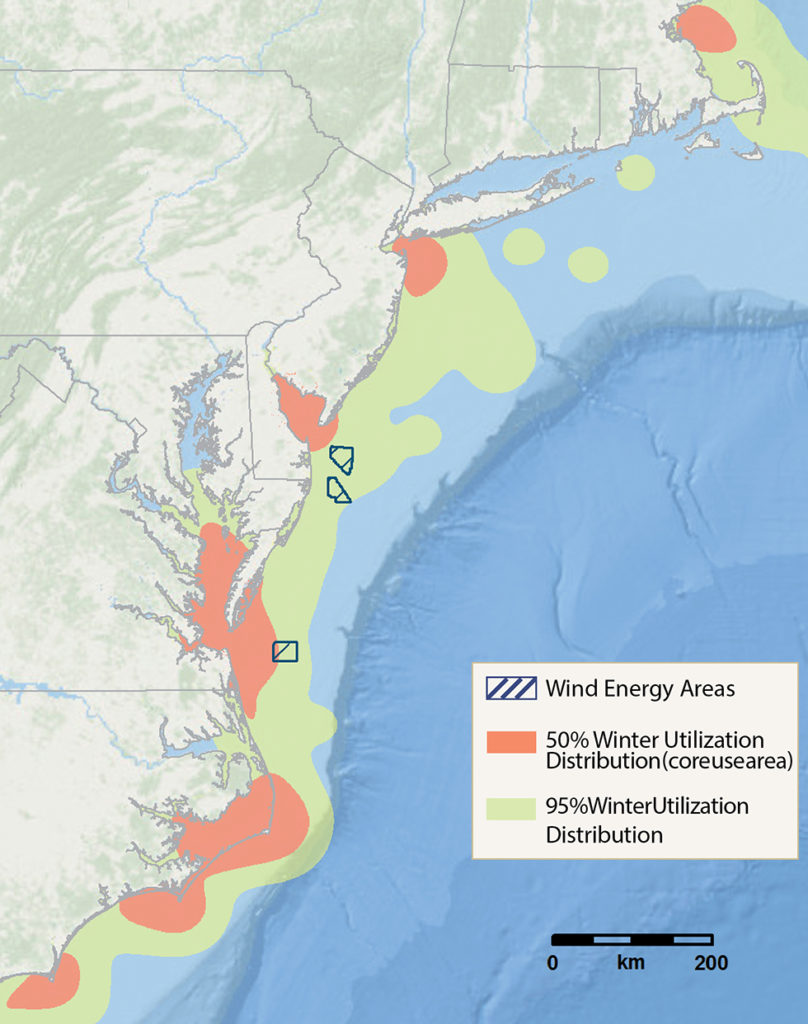
Satellite telemetry data can be aggregated to identify species-specific patterns in habitat use and movement behaviors in relation to changing environmental conditions. Kernel density estimation uses locations from satellite tracked animals (point data) to estimate spatial use during specified time intervals. Random samples of daily points were pooled to create a composite map for all wintering individuals, for each species. These maps show estimated core use areas, where tagged birds spent the majority of their time (the area encompassing >50% of the daily points), and utilization distributions, in which birds spent most of their time (the area encompassing >95% of the daily points).
We also used state-space models to identify detailed behavioral patterns from tracking data. Fast, straight movements indicate transient behavior, while slower, circular movements indicate the animal is using marine resources by foraging or resting. We used movement patterns in Northern Gannets to identify the environmental conditions correlated with intensive resource use.
Utilization Distribution

Utilization distribution (UD) maps are derived from satellite telemetry data and estimate the areas used by tagged animals 95% of the time (yellow) as well as core use areas (within the 95% use areas, in pink). While survey data provide “snapshot” information on population distributions, UD maps characterize the habitat use of a group of individual animals over time. This map shows a subset of data for the Northern Gannet.
Project Team and Funding
Seabird telemetry data are from several multi-year collaborative field studies focused on the movement patterns of Red-throated Loons, Northern Gannets, and Surf Scoters in the Atlantic flyway, carried out by numerous principal investigators and agencies: 1) Determining Offshore Use of Diving Bird Species in Federal Waters of the Mid-Atlantic United States Using Satellite Tracking, developed by the Bureau of Ocean Energy Management (BOEM) and the U.S. Fish & Wildlife Service (USFWS), and 2) the Atlantic and Great Lakes Sea Duck Migration Study, developed by the USFWS, Canadian Wildlife Service (CWS), and other state and federal partners. The first study was designed in partnership with the U.S. Geological Survey (USGS)-Patuxent Wildlife Research Center, Biodiversity Research Institute (BRI), and Memorial University of Newfoundland (MUN), and funded by BOEM, the Department of Energy (DOE; Award Number DE-EE0005362), BRI, MUN, and The Bailey Wildlife Foundation. The second project was primarily funded by the USFWS through the Sea Duck Joint Venture, DOE, and BOEM. Other partners that provided logistical or financial support include the Canadian Wildlife Service, Maryland Department of Natural Resources, Virginia Department of Game and Fisheries, University of Rhode Island, Delaware Division of Fish and Wildlife, and North Carolina Wildlife Resource Commission. Results presented here include data through the end of 2013, including the first two years of the BOEM/USFWS study and all prior years of the SDJV study.
References
- Johnson, D.H. 1980. The comparison of usage and availability measurements for evaluating resource preference. Ecology 61: 65-71.
- Keating, K.A. & Cherry, S. 2004. Use and interpretation of logistic regression in habitat-selection studies. Journal of Wildlife Management 68: 774-789. Montevecchi WA, Hedd A, McFarlane Tranquilla L, Fifield DA, Burke CM, Regular PM, Davoren GK et al (2012) Tracking Seabirds to identify ecologically important and high risk marine areas in the western North Atlantic. Biological Conservation 156:62-71. do: 10:1016/jbiocon2011.12.001
- Silverman, B.W. 1986. Density estimation for statistics and data analysis. Chapman and Hall, London, UK.


